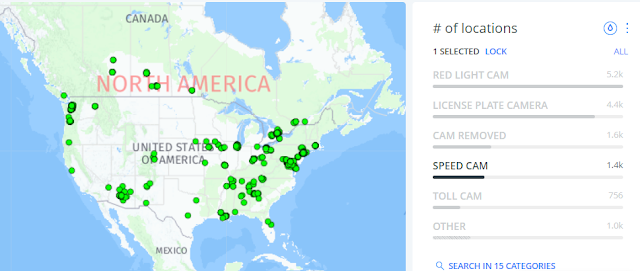
Speed regulation is mostly the responsibility of state and local governments. Traditionally, the federal government's responsibility has been to accumulate speed-trend and safety information, undertake and coordinate research, fund national highway and safety programs, and regulate new vehicle standards. There are two notable exceptions.
• From 1942 to 1945, the War Department ordered a nationwide speed limit of 35 mph to conserve rubber and gasoline for the war effort.
• In 1973 during the oil embargo, Congress enacted the National Maximum Speed Limit, set at 55 mph, to conserve fuel.
The NMSL was repealed by Congress in 1995, ending Federal penalties for noncompliance as well as the obligation for states to provide speed compliance statistics. States and communities have demonstrated increased interest in discovering better ways to efficiently manage speeds and minimize speeding-related crashes in the years since the repeal.
Since the NMSL's repeal, the federal government's role has evolved from NMSL compliance and enforcement to conducting research and providing recommendations in support of state and local highway safety programs, as well as providing science-based countermeasures and technical guidance for reducing speed.
The most popular approach for controlling speed is to set speed restrictions. In the 1920s and 1930s, the current framework for setting speed limits was devised. Every state has a basic regulation requiring drivers to travel at speeds that are acceptable and prudent in light of the current environment. State statutes establish speed restrictions that apply to a variety of road types and geographic areas. State and most municipal governments, on the other hand, have the right to establish speed zones for highway portions if statutory restrictions do not meet specific road or traffic conditions based on engineering studies.
In speed zones, speed restrictions are set for ideal conditions such as good weather, free-flowing traffic, and good visibility. As conditions change or deteriorate, drivers are expected to reduce their speeds. The most common approach is to set the limit based on an engineering study that considers factors like free-flowing vehicle operating speeds, crash experience, roadside development, roadway geometry, and parking and pedestrian activity levels to determine what speed the posted limit should be set at. When systems for setting speed limits are perceived as subjective and poorly understood, pressure from the public or elected authorities to lower speed restrictions is prevalent and difficult to resist.Speed management is a highly localized issue, with States and towns having the freedom to choose the right balance of risk and mobility.
Auburn, WA has speed and red light safety camera locations.
Baltimore, MD has speed and red light safety camera locations.
Denver, CO has speed and red light safety camera locations.
Chicago, IL - has lots of speed and red light camera safety camera locations.
Cedar Rapids, IA - has speed safety camera locations.
Chattanooga, TN - has speed safety camera locations.
Montgomery County, MD experienced a 59% decrease in the likelihood of a driver exceeding the speed limit by more than 10 mph and reported a reduction in fatal or incapacitating injuries by 49% on roads with speed safety cameras.
New York City, NY speed cameras are only allowed in designated school zones, which encapsulate a quarter-mile radius of school buildings. The current law — an expansion of a school-zone camera program implemented in 2013 and expanded in 2019 — is set to expire in 2022
New Orleans, LA - has speed and red light camera safety camera locations.
Portland, OR reported a 46% reduction in traffic fatalities from an average of 56.8 annual traffic deaths before the program's implementation to an average of 30.5 traffic related deaths as the program has grown. Average and 85th percentile speeds also declined at speed safety camera locations. There was 85% decrease in the number of drivers exceeding the speed limit by 10 mph or more
Providence, RI - has speed safety camera locations
Seattle, WA had an overall calming effect on the city reporting a 4% reduction in the average speed of a speeding violation in miles per hour above the posted speed limit
Washington, D.C. experienced a 73% reduction in traffic fatalities, a decrease from 71 deaths in 2001 to 19 deaths in 2012 and a 34% decrease in traffic related injuries. Whereas one in three drivers were travelling 10 mph above the speed limit, when cameras were introduced the rate of speeders dropped to just one in 40 drivers.


